


This article originally appeared in the first print issue of Works in Progress, which subscribers received last week. Subscribe to get six full-color editions sent bimonthly, plus invitations to our subscriber-only events.
Competition between companies is seen by most economists as the engine of innovation, economic growth, and prosperity in modern market economies. Competition is one of the only economic forces to have laws and dedicated regulators set up to promote it, and nearly everyone agrees that some interventions to promote it are worthwhile. But while virtually everyone agrees that competition is a very good thing, it is much harder to agree on what competition actually looks like.
Instead, economists, courts, and regulators rely on imperfect proxies for competition. But these are often contradictory. They can even lead to perverse outcomes that few people think desirable: legal challenges, prohibitions on business practices that would actually increase innovation or growth, and bans on mergers that, paradoxically, can leave markets less competitive.
A reliable and usable measure of competition that actually matched up with other measures of whether a market is healthy or not is something of a holy grail in economics.

Imperfect proxies for competition
Traditional accounts of competition use proxy measures like market concentration, which looks at how much market share the biggest companies have.
A country that had only two grocery store chains, each of which had 50 percent of the market, would be said to be highly concentrated compared to a country that had a thousand stores, each of which earned 0.1 percent of shoppers’ grocery spending. This may seem intuitive enough, but it can be misleading.
For one thing, looking at concentration at a national level can obscure what’s going on at the local level. Nationwide, concentration in America’s retail sector has been rising since the early 1990s as chains like Walmart, Kroger and Target have opened more branches across the country. Concentration as it’s usually measured more than tripled between 1992 and 2012. But retail concentration at local levels increased by only about a third over the same period. The growth of nationwide chains meant new stores opening up in areas that only used to have a handful of smaller local stores, exposing them to new and often intense competition to cut their prices and improve their offerings.
Even when concentration does rise, it’s not always bad for competition. Bigger companies can benefit from economies of scale that allow them to invest in better technology and purchase or produce goods in bulk, which allows them to drive down prices. These benefits can outweigh any loss to competition from fewer companies being in the market. Rising concentration can be a sign of a market that is working well, with more productive companies growing at the expense of lesser ones.
The problem with concentration exists when we zoom out from countries too, and consider international trade. When trade barriers fall, the best companies in a country will grow larger as they expand overseas, and weaker domestic businesses may exit under the pressure of competition from foreign companies, and from their most efficient domestic rivals, which now enjoy greater economies of scale from exporting internationally.
In general, concentration is an outcome of market processes, not a cause. This isn’t just a data collection problem that better measurement could solve. Even if we could measure concentration perfectly – counting every firm, tracking every market share change in real time – it still wouldn’t tell us what we actually want to know about competition. The measure is not just noisy: it often points in the wrong direction. Why would we continue to use it?
Instead of market concentration, more sophisticated analyses of market power have turned to markups: the gap between how much it costs a company to produce more of its product, and the price it charges for them. But this approach is nearly as flawed. High markups could simply be a reward for investment in better products or cost-saving technologies.
A pharmaceutical company might charge high prices relative to manufacturing costs to recoup large R&D investments. Novo Nordisk, the company behind Ozempic and Wegovy, saw annual profit growth of 27, then 36, then 31 percent in 2022, 2023, and 2024 as the world realized that its diabetes drug was also an effective weight-loss tool.
Companies that make breakthroughs or other productivity improvements must earn higher markups for some period of time, or else there would be little incentive to bear the costs of becoming more productive. As with concentration, the presence of markups is often a signal that a market is working well, not that there is a competition problem.
A more useful measure of competition would be based on what we’re actually trying to get competition to do, working backwards from the outcomes we want in order to see what the features are of markets that deliver them. Competition works because it rewards businesses that find better ways to serve customers, and punishes ones that overcharge their customers or offer substandard products. If markets are competitive, then businesses that make desirable products at lower cost will grow larger as customers switch to them, putting pressure on their competitors to improve by cutting prices or making better products. They may face the prospect of having to exit the market altogether.
In short, we want to measure whether markets are rewarding excellence or sclerosis. It turns out that such a measure exists: what is called the Olley-Pakes decomposition. The decomposition measures whether customers are switching to more productive companies. If productive companies are gaining market share, we might judge that the market is competitive and working well. If they’re not, and more productive businesses are not doing better than less productive ones, something is wrong, and intervention could be necessary.
Measuring dynamism
In 1950, Japanese auto manufacturers produced 31,597 vehicles, only as much as the US produced in a single day. But the constraints imposed by post-war Japan led them to choices that would make them much more productive than American manufacturers.
After reading a newspaper article about American supermarkets, Toyota executive Taiichi Ohno imposed a system of ‘pull’ manufacturing: rather than each supplier sending along the same output no matter the demand (as in the ‘push’ system preferred by US suppliers), Toyota’s plants would only ever have in their inventory what was needed for the next production run with a small buffer. In order to further limit expenses, Toyota engineers bought cheap general-purpose stamping presses, limited the number of models on offer, and standardized the parts that went into them.
Workers were generalists, and told to oversee much larger production lines than their American counterparts. By 1963, Toyota workers were overseeing five machines each, compared with three in 1949, and one in 1946. Seeing the problems that American firms had with labor disputes, auto bosses packed their unions with white-collar workers, and offered union leaders management roles and influential workers lifetime jobs.
By the time Toyota and Nissan started entering the US auto market en masse in the 1970s, the Japanese manufacturers were significantly more efficient than their American counterparts, producing more reliable cars and employing fewer labor hours per vehicle.
But the industry’s overall productivity would see only a minimal improvement after the arrival of these Japanese companies. While their extremely productive plants, both in Japan and the United States, had now joined the market, and slightly raised the average productivity of automobile manufacturers selling cars to Americans, the Japanese companies were producing so few cars that this barely affected the total, compared to the dominant, but less efficient, American incumbents.
Over time, American consumers began to realize how good Japanese vehicles were. As Toyota and Honda expanded production, their more efficient plants began capturing larger market shares. The Japanese manufacturers were using the same production techniques as before, but over time, customers switching to them meant more resources shifting towards them. This was a competitive, dynamic market working more or less the way it should.
This shift is what is captured in Olley-Pakes, which breaks productivity down to two components: the average efficiency of firms weighted by market share; and the simple unweighted average efficiency of all firms, regardless of size. The difference between these, called the ‘covariance’, reveals whether the market is actually rewarding efficiency. If it is positive, larger firms are more productive than the industry as a whole and the market is performing well. If it is negative, something is stopping better companies from growing larger than their rivals.
In the auto industry’s case, the unweighted average efficiency of the companies in the market barely changed when the Japanese auto makers arrived. But as efficient Japanese manufacturers sold more and more cars to Americans, the covariance increased substantially.
The advantage of this approach is that, instead of relying on judgements about how many firms constitute a competitive market, which might differ in different markets at different times, or about how much money companies ‘should’ make, it looks at whether the market is actually rewarding more efficient firms, and separates technological progress from market allocation.
The covariance can increase even as concentration rises. Unlike concentration measures, the Olley-Pakes decompositions can judge that competition is strengthening as industries consolidate, if the success of more productive firms is what is driving that consolidation. Studies have found that the relationship between productivity and market share tends to strengthen following pro-competitive reforms and is higher in countries that are generally viewed as having more competitive markets.
In order to see how the Olley-Pakes decomposition would affect competition policy if we used it instead of other measures, I’ll look at two instructive examples: the end of the AT&T monopoly on telephones, which is near perfect example of a legalized monopoly ending, and Colombia’s economic liberalization in the 1990s, which is a good case of nationwide pro-competition reform outside of a crisis.
America’s telephone monopoly
For most of the twentieth century, AT&T operated America’s dominant phone network and provided both phone services and the devices that connected to the network. It served around 75 percent of the country’s local telephone service, and almost all long-distance calls. Households did not buy phones: they leased them; and because AT&T generally did not permit third-party devices to be used on its network, its manufacturing subsidiary, Western Electric, supplied 90 percent of the equipment on AT&T’s network.
The standard desk phone was the Western Electric Model 500: a solid black rotary phone. Insofar as there was any competition at all, it was between AT&T telephones and highly imperfect substitutes like sending letters or telegrams, or actually traveling to the person you wanted to speak to, and so on.
The 1968 Carterfone decision forced AT&T to allow certain third-party equipment to connect to its network. This had a dramatic effect on competition: the number of manufacturing plants of telecommunication equipment like central office switches and telephones nearly doubled between 1967 and 1972 as new firms rushed in. By 1987, there were 584 plants operated by 481 different firms, up from just 164 plants and 131 firms in 1967.
Turnover was high: around 60 percent of the plants operating in 1972, accounting for 40 percent of the output and jobs in the industry, had closed by 1987. Over two fifths of plants active in 1982 failed to survive to 1987, representing about a quarter of 1982’s production.
This high turnover of the companies making consumer telephones became even more pronounced after a legal decision forced the breakup of AT&T’s network into seven regional networks in 1984.
We can use this as a base case of an extraordinarily competitive market. All three of our measures would correctly identify it as such: concentration fell as a monopolist was forced to share the market with many competitors. Markups were not tracked, but almost certainly fell as the products were simple and similar, not based on extensive R&D or intellectual property protection.
The Olley-Pakes decomposition finds the same result: the average manufacturing plant’s efficiency didn’t see much improvement between 1974 and 1987.
Individual plants weren’t suddenly becoming dramatically better at making phones just because of new competition. What shifted was which plants were doing most of the production. At the start of this period of competition, a plant’s efficiency had virtually no connection whatsoever to how much it produced (the correlation was just 0.01 in 1974). Factories that could make phones quickly and efficiently had essentially no ability to gain market share at the expense of their slower, costlier rivals. Since AT&T’s customers had no choice which company to buy their device from, and since AT&T would not lose customers by making them go to inefficient suppliers, there was no extra business for manufacturers who could outproduce their competitors.
By 1980, this had changed. The opening up of the telephone market to choice and competition meant that, at last, customers could shop around for cheaper, better phones, and more efficient producers could benefit. The correlation between a plant’s efficiency and its share of production jumped from 0.01 to 0.28 by 1980. A year later, it reached 0.35.
This historical example is like a control group: it shows that in the most obvious cases of increased competition, the Olley-Pakes decomposition finds the right thing, agreeing in these cases with both concentration and, very likely, markups.
Reforms in Colombia
We can think about competition in this way not just for individual sectors, but for entire economies. Unlike many other countries that have gone through significant economic reforms, 1990s Colombia was not in the midst of an economic crisis. Instead, a convergence of external pressure, from the World Bank to the growing popularity of the Washington Consensus, provided the initial impetus for the reforms, and President César Gaviria’s reformist government then pushed them even further.
Trade liberalization was central to the reform program. The country slashed its average tariff on imports from over 62 percent to around 15 percent, exposing domestic producers to much stronger international competition. Labor markets were also liberalized: the costs of dismissing workers fell by 60 percent or more, making it easier for firms to restructure their workforces.
Before these reforms, a factory’s success often had little to do with how efficient it was at making products. A plant could be relatively wasteful with materials and labor but still do well if it had a strong local customer base, since only domestic companies could compete and it was expensive and risky for new companies to enter the market.
In the case of the car industry, Colombia’s protectionist policies supported a market dominated by just three domestic assemblers of parts made abroad. Foreign-assembled vehicles were effectively locked out by tariffs, which averaged around 200 percent. Cars sold in Colombia typically cost two to three times their international price while offering fewer features and lower quality.
The reforms cut tariffs on foreign-made cars from 200 percent to approximately 38 percent between 1990 and 1992. In 1991, only 26 car models were available in Colombia, all domestically assembled. By 1992, just one year after the reforms, 71 different models were on offer, 44 of which were imports.
The price of cars collapsed after the reforms, from a high of $25,000 (in 1996 terms) in 1987 to just over $15,000 ten years later, while car sales doubled almost immediately. Domestic manufacturers also grew their sales, as the car market in general grew, but they lost market share. Market liberalization led to lower prices, expanded consumer choice, and a reallocation of market share reflecting the new competitive landscape.
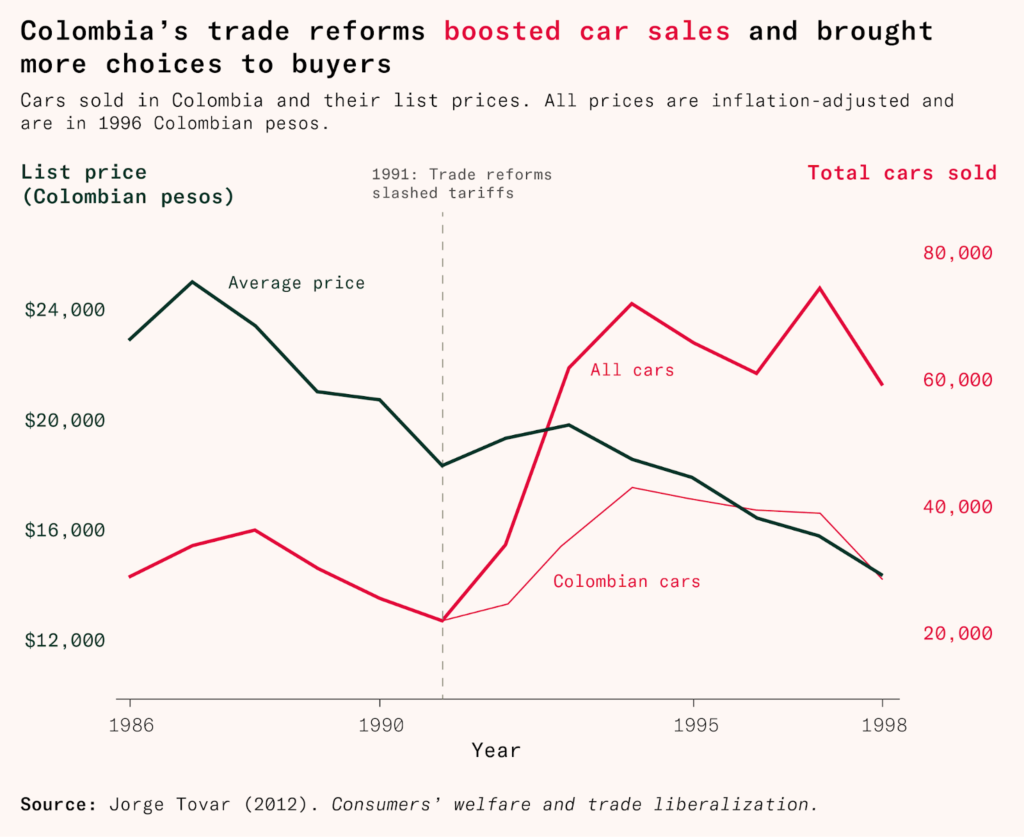
Over five years, existing factories got better at what they did, improving their own efficiency by about three percent. But the biggest gain came from the market’s new ability to reward efficiency. More productive factories grew larger faster than less productive ones, which meant that overall productivity grew nearly eight percent. Hence, the difference between weighted and unweighted productivity – the covariance – increased.
This was part of a broader pattern across Colombian manufacturing. New competition from overseas forced domestic producers to get their acts together or lose market share. Manufacturers that faced the greatest import competition simultaneously increased their productivity and lost demand to even more productive overseas rivals.
Britain’s missing productivity
Measuring competition accurately can also allow us to explain more complicated stories, such as British economic stagnation in the decade after the 2008 crisis.
Economic recessions often have a ‘cleansing’ effect: less productive firms exit while more efficient ones survive and potentially expand. In the immediate crisis years between 2007 and 2010, the correlation between productivity and market share in Britain remained stable, suggesting that competition was working just as it did before the crisis, with market share still flowing to more efficient producers.
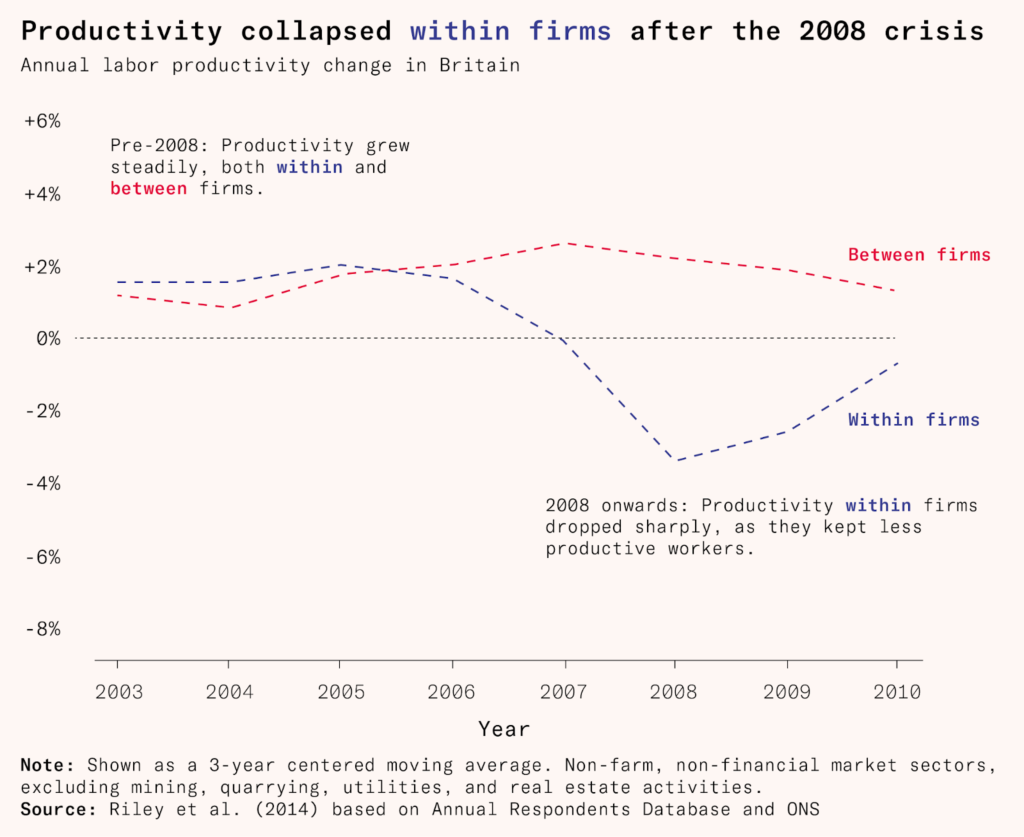
But beneath this surface stability, more troubling patterns were emerging. Unlike the 1990–92 recession, after which productivity within manufacturing firms rebounded strongly, the post-2008 period saw persistent weakness in productivity growth inside companies, and this occurred across sectors as diverse as financial services, mining, and electricity and gas.
So what was going on? Subsequent Bank of England research found that, in the years following the financial crisis, many companies facing falling demand were nonetheless holding onto their employees. Before the crisis, in more normal times, about nine in ten companies with falling output also cut employment. During the recession, that fell to four in five. Since their staff had less to do, because demand was down, productivity fell.
In a highly competitive market like retail, where profit margins are razor thin and labor costs can represent around a fifth of total business expenses, having just ten percent more workers than your competitors is a huge burden. Businesses facing stiff competition can’t afford to keep excess workers: competitors would undercut their prices and steal their customers.
But many of these struggling companies continued operating. Company death rates were estimated to be as little as half what they would be in a counterfactual world where the economy behaved like it did in previous recessions. Net entry, which is firm entry minus exit, was actually positive by 2010, despite the terrible economic environment.
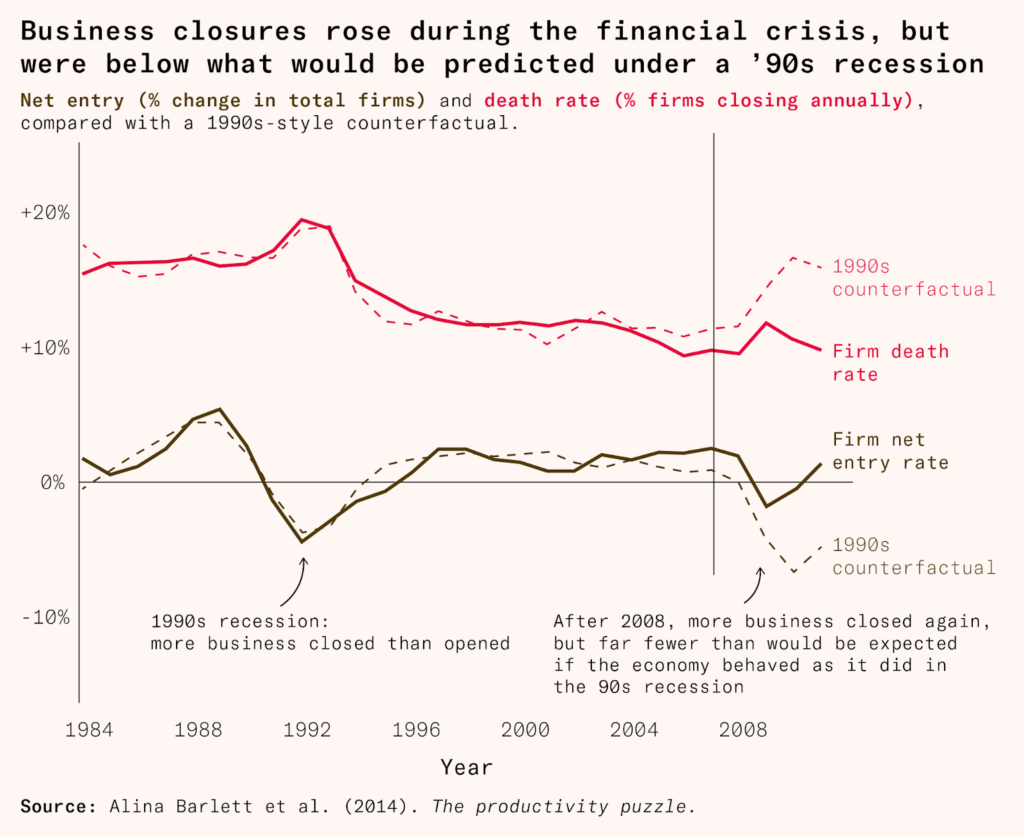
In prior recessions these firms would have died. Instead they staggered on, tying up workers and capital that could have flowed to more dynamic new businesses. While in the earliest crisis years we saw a stable correlation between market share and productivity, over time, the UK’s reallocation engine began sputtering, and the link between productivity and business growth measured by the Olley-Pakes decomposition began to fall.
This twin deterioration – falling productivity within firms, plus impaired reallocation between them – is one good candidate for explaining the UK’s puzzling post-crisis economic performance. Between 2010 and 2019, worker productivity grew by eight percent in the United States and 9.6 percent in France (from a lower level), but by just 5.8 percent in Britain. And this is despite the fact that British productivity was already substantially lower than both the French and the American level.
The Olley-Pakes measure detected meaningful changes in market functioning that help explain the UK’s productivity performance after 2008. This is what we want from a competition metric: the ability to identify when markets are or aren’t effectively reallocating resources to more productive firms.
None of this tells us what went wrong, of course. The UK’s Competition and Markets Authority, along with most other competition authorities, would wonder if something was amiss if it saw rising concentration in a market, or rising markups. It has a kit full of tools for tackling issues in markets that have these problems. But the post-crisis stagnation wasn’t caused by traditional competition problems like cartels or monopolies. Instead, it was caused by a breakdown in the mechanisms that normally reward productive firms and pressure unproductive ones.
If the search were thought about in terms of falling reallocation from unproductive companies to more productive ones, it might look for other culprits. Those might be things like bank forbearance policies, under which struggling firms were kept alive for longer; low interest rates, which allowed companies to refinance debt rather than going broke; or housing policies preventing workers from moving from struggling parts of the country to relatively prosperous ones. One way or another, if policymakers at the time had used Olley-Pakes, they might have had a better idea about what was going wrong and been able to address it sooner.
Better measurement leads to better policy
These four examples show how useful the logic underlying the Olley-Pakes decomposition can be to capture meaningful changes in how markets function. Olley-Pakes tells us competition is rising in the obvious cases that concentration and markups get right, as in US telecommunications after the AT&T breakup. But where it excels is giving us the right answer when markups and concentration fail: for example in post-Great Recession Britain, where the process of creative destruction stalled despite no real change in markups or concentration.
British policymakers, seeing no change in markups or concentration after the 2008 recession might judge that competition was not the problem, and that they didn’t need to worry about it. But they would be mistaken because they had the wrong data.
Increasing concentration and rising markups are often signs of functioning markets where demand is flowing to the most productive firms, such as is the case with weight loss medication today. In order to distinguish between those cases, and ones where markets genuinely are dysfunctional, such as in pre-liberalization Colombia, we need a metric that tells us whether the largest firms are in fact the best.
The Olley-Pakes covariance term itself requires more data and detail than we have from some of these episodes. It needs firm-level information on both productivity and market shares over time, data that are rarely available across all sectors. The studies that have implemented this approach well, like the Colombia case above, required exceptional datasets with plant-level price information, physical output measures, and detailed input tracking across many years. But if competition and statistics authorities decided that there was merit in this measure, they could start to collect this data more thoroughly, and we could really begin to understand if we’ve found the key to understanding competition as it really works.
Brian Albrecht is chief economist at the International Center for Law and Economics. Follow him on Twitter.
 | A guest post by
|
Next question: how do courts and regulators get the data to apply the Olley-Pakes decomposition to a case which is before them?
I had never heard of Olley-Pakes. Thank you!
A much less well-thought-out example on a similar question, namely the suckiness of GDP.
"What if we based our planetary (and interplanetary) economies not on imaginary 'credits' but on measurable units of energy?"
http://www.intergalacticmedicineshow.com/cgi-bin/mag.cgi?do=columns&vol=randall_hayes&article=002